Hey guys, today is April 25th, 2020!
I have been collecting data, and conducting my own market research on the stock market for the past 3 weeks.
There is a lot of uncertainty regarding the direction of the stock market, and that seems to be an obstacle for a lot of traders. I am going to present my ultimate battle tested strategy in this article.
This strategy is the absolute conclusion of my experience within the past 3 weeks. I have been testing these strategies with real money and paper trading. I have conducted about 100 trades in the past 3 weeks. As an experienced trader, I have absolute confidence that these conclusions will hold true, and I will continually test them in the weeks to come.
A Chinese general who helped conquer the Qing Dynasty said one thing that I will always keep in my mind,
” If your battle strategy has worked in the past and it is currently failing, it doesn’t mean that your battle strategy doesn’t work. It means that the timing and execution of your strategy needs a slight alteration”
Let’s dive in.
There are two things you want to view before beginning your trading day. I highly suggest that you view them prior to the opening bell. These two things are the VXX Barclays iPath of volatility, and the SPY SPDRs ETF S&P500. The tickers are simply VXX and SPY.
The VXX should start declining as the SPY is increasing. The opposite holds true if the SPY is decreasing.
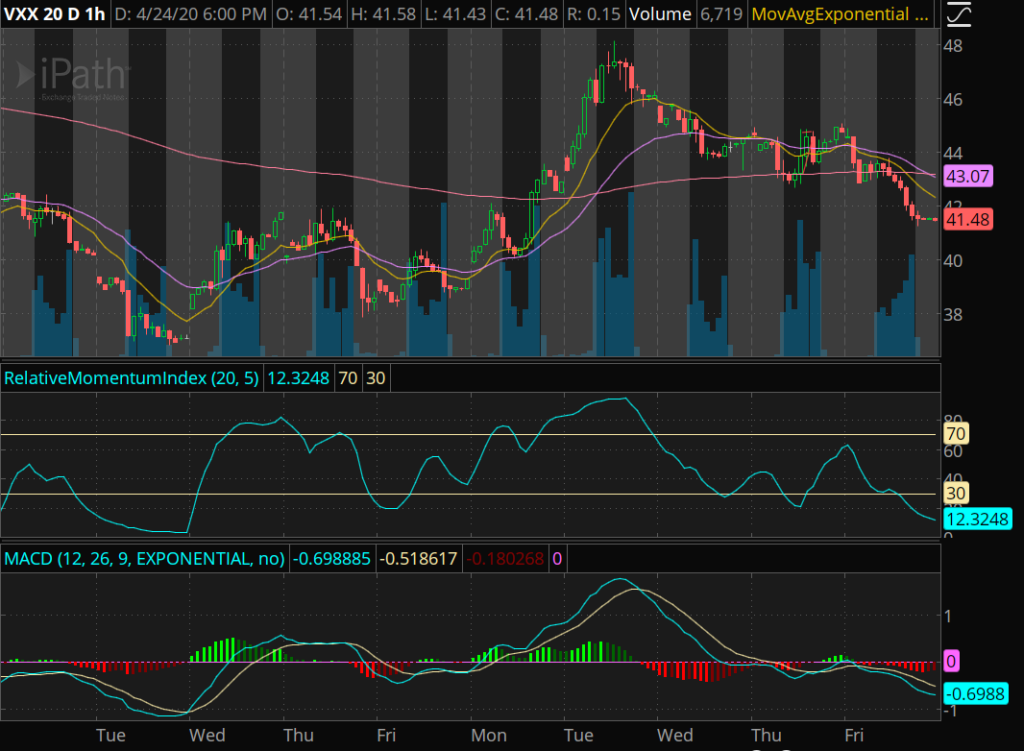
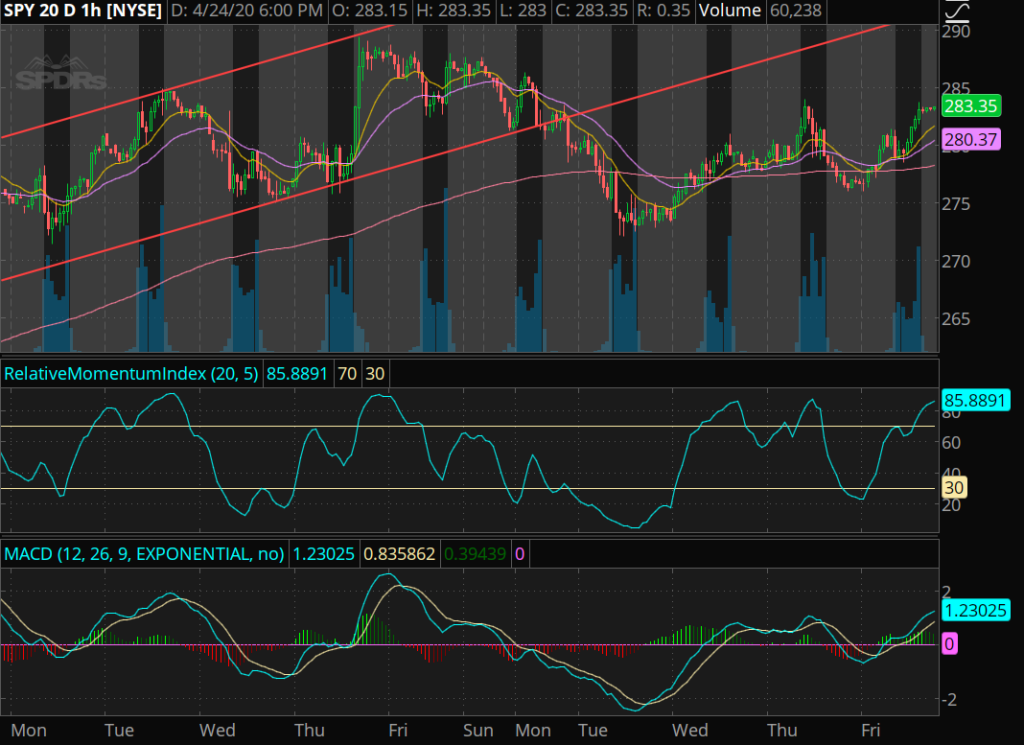
Let’s take a look at these two charts:


Based on all the trading elements depicted in my videos, you can see that as one goes down, the other goes up. This holds true for all of the trading elements.
This is a very important concept to know like the back of your hand.
If you are trading a S&P 500 stock, for the most part, it should be following the trend of the SPY. If the SPY is going up, that ticker should be going up. Make sure that the VXX is going down.
If there is uncertainty in the market, you can easily identify this by seeing if the VXX is going up or down and the SPY is going sideways.
This is also true if the SPY is going up or down, and the VXX is going sideways.
By understanding the gravitational theory that I have presented in my previous articles, you can see that on Friday 4/24/20, the VXX yellow and purple lines have crossed through the gravitational pink line, and they are heading downwards. This is a heavy indication that the SPY will make a move upwards.
As you can see on the same date, the SPY has made a heavy bounce above the gravitational pink line. (This is the OPPOSITE reaction).
This concept is very important when deciding whether to buy options calls or puts on a stock.
How does this help you? It’s quite simple.
Buy calls when the SPY is going up and the VXX is going down. Buy puts when the SPY is going down and the VXX is going up.
I am going to identify some special case scenarios that you need to watch out for.
First, let me identify two types of days on the stock market.
Red days and Green days.
I use finviz to clearly see, within 1 second, what type of day it is.
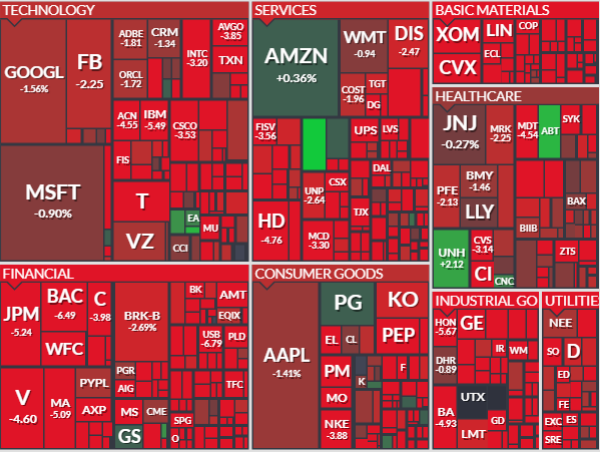
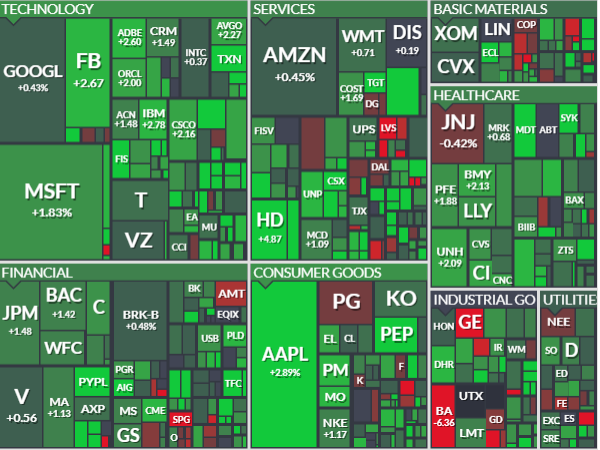
Red means the overall market is crashing. Green means the overall market is going up.
Take a look at these two pictures:


These two pictures clearly identify how the day is going.
I am going to explain some simple psychology concepts based on the type of day the market is having.
First know this, the media is controlled by large banks and huge institutional funds. They are the “game master” they can pump any type of news into the world to force the market to go a specific way which will ALWAYS be in their favor for maximizing profit.
If you open finviz and you see a red day. The market is crashing, most likely due to bad news or some type of panic about the Coronavirus and economy.
Following bad news, this next scenario holds true about 90% of the time.
Day 1, the market crashes. Day 2, people who didn’t have their stop losses popped begin to panic as they see their portfolios lose money. These people “Guh” and begin selling, and this causes the domino effect to crash the economy out of fear.
By understanding the psychology of these traders, you can do 3 things.
- If you purchased a call that is going upwards against the market trend, take the day trade.
- Buy puts on day 1 of the crash, because day 2 will be another crash.
- Wait till day 2 and buy calls, because the market will recover as profits become maximized.
If you open finviz and you see a green day. The market is being pumped up, this is most likely due to the institutions picking up cheap stocks and drastically limiting the supply which increases the demand.
Following a green day, this next scenario holds true about 90% of the time.
Day 1, the market goes up. Day 2, people see that the market is going up and they begin to buy in. Day 3, the market goes up again as the domino effect occurs (Scenario A).
Day 3 also has another scenario (Scenario B). The market went up really fast after day 2, and people begin to lock in their profits and they start selling.
By understanding the psychology of these traders, you can do 3 things.
- Purchase a call on day 1 and swing trade it the next day.
- Purchase a call on day 2 and day trade it.
- Purchase a put at the end of day 2 or 3.
Make sure to always check the VXX and SPY with respect to each trading day, because that will give you an edge in knowing exactly if the green day is going to follow scenario A or B.
Stay tuned, learn more, ask questions. Become a 6 digit survivor. Check out the live stream.
Join my robinhood team and get a free stock here
Learn about my Indicators here.
Become a member and learn!
Disclaimer:
I want to point out, I am not a registered investment adviser or broker/dealer. I am a highly profitable options trader who has been successful time after time, and I have changed the lives of many people through the art of trading on the stock market.
– Ken


